
Long time readers of my blog know that I’m preferring prstat over top any time. The micro state accounting in prstat gives you a much deeper, much more precise insight. Using a tool not capable of using micro state accounting is like watching a video in 240p instead of 4K (to stay at this: DTrace is like 8K ;) ).
However, sometimes it’s interesting to know what happened in the past since the startup of the process. And there is a tool giving you this kind of data. With ptime -m you can look up the information collected by the micro state accounting since the creation of the process:
root@testbed:~# ps -ef | grep "ssh"
root 492 1 0 21:14:45 ? 0:00 /usr/lib/ssh/sshd
root 1631 492 0 21:20:37 ? 0:00 /usr/lib/ssh/sshd -R
root 1398 1055 0 21:15:42 ? 0:00 /usr/lib/ssh/sshd
jmoekamp 1635 1631 1 21:20:42 ? 0:00 /usr/lib/ssh/sshd -R
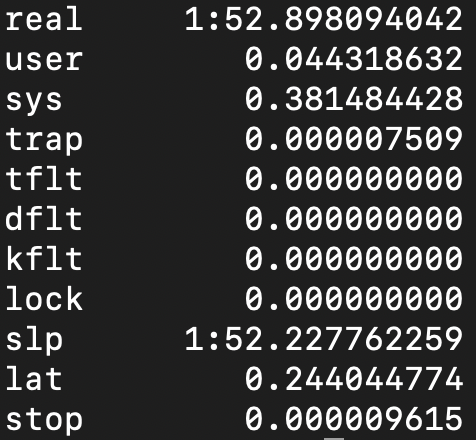
root@testbed:~# ptime -m -p 1635
real 1:52.898094042
user 0.044318632
sys 0.381484428
trap 0.000007509
tflt 0.000000000
dflt 0.000000000
kflt 0.000000000
lock 0.00000000
slp 1:52.227762259
lat 0.244044774
stop 0.000009615
root@testbed:~#
I’m using the tool quite often to get snapshots of the values for a process, writing them to a file and calculating the differences over multiple hours. For this task it’s much more practical than using prstat. A description of the values is in the man page; however, it’s pretty much the same as in prstat -m.