
(originally published on 27.02.2019, reviewed/rewritten on 08.04.2025, tested on Oracle Solaris 11.4 SRU 79)
Sometimes a feature isn’t about something you weren’t able to do without the feature, but about making already available information easier to acquire or much more accessible. Like information you gathered so far with DTrace and some homegrown scripts before, but now are able to get by a simple option.
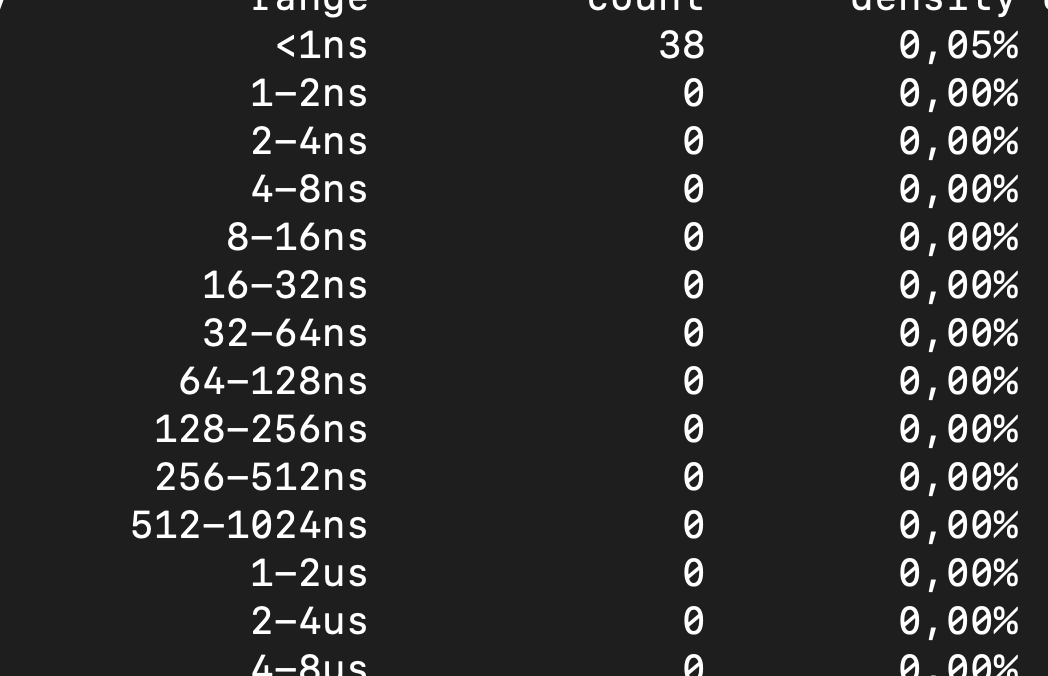
The -L option of the iostat command is such an example. With this command it’s really easy to get a latency distribution of the accesses to your disks. As an example I will show you the command output for a single device:
root@testbed:~# iostat -x -L sd0
                     extended device statistics
device     r/s    w/s   kr/s   kw/s wait actv wsvc_t asvc_t  %w  %b
sd0       2,1   11,0   52,5   69,4  0,0  0,0    0,1    0,3   0   0
latency          range         count      density distribution
<1ns            38        0,05%        0,05%
1-2ns             0        0,00%        0,05%
2-4ns             0        0,00%        0,05%
4-8ns             0        0,00%        0,05%
8-16ns             0        0,00%        0,05%
16-32ns             0        0,00%        0,05%
32-64ns             0        0,00%        0,05%
64-128ns             0        0,00%        0,05%
128-256ns             0        0,00%        0,05%
256-512ns             0        0,00%        0,05%
512-1024ns             0        0,00%        0,05%
1-2us             0        0,00%        0,05%
2-4us             0        0,00%        0,05%
4-8us             0        0,00%        0,05%
8-16us             0        0,00%        0,05%
16-32us             0        0,00%        0,05%
32-64us             0        0,00%        0,05%
64-128us             0        0,00%        0,05%
128-256us         65628       77,76%       77,80%
256-512us         11730       13,90%       91,70%
512-1024us          5731        6,79%       98,49%
1-2ms           716        0,85%       99,34%
2-4ms           135        0,16%       99,50%
4-8ms           294        0,35%       99,84%
8-16ms           117        0,14%       99,98%
16-32ms             8        0,01%       99,99%
32-64ms             5        0,01%      100,00%
64-128ms             1        0,00%      100,00%
>128ms             0        0,00%      100,00%
                 total         84403
So you don’t have to use DTrace scripts any longer to get this kind of information.