
(originally published on 28.02.2019, reviewed/rewritten on 10.04.2025, tested on Oracle Solaris 11.4 SRU 79)
After my blog entry about showing latencies at disk level, I want to highlight another tool that is now able to display latencies: fsstat. It does its job somewhat up the layers (or layer, given a blatant layering violation is in place). The fsstat command got a -l option. With this tool you can check latencies from the perspective of the filesystem. It does so for read, write and readdir operations.
In this example I’m using the root filesystem with some artificial load to gather some data. It’s really simple to use.
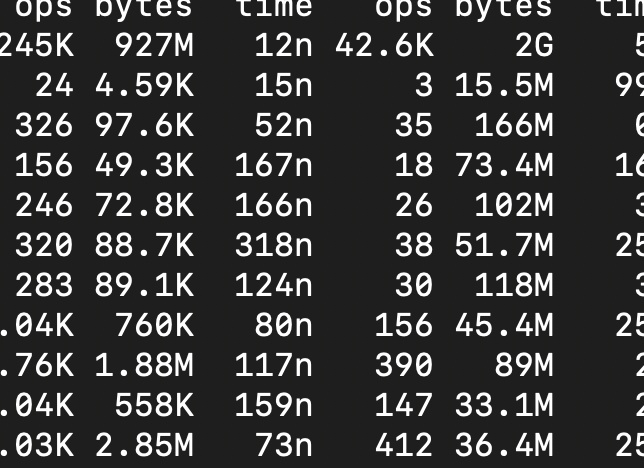
root@testbed:/# fsstat -l /  1
 read read   read write write write rddir rddir rddir
  ops bytes  time   ops bytes  time   ops bytes  time
245K  927M   12n 42.6K    2G    5n 18.1K 8.88M  114n /
24 4.59K   15n     3 15.5M   99n     0     0    0n /
326 97.6K   52n    35  166M    0n     0     0    0n /
156 49.3K  167n    18 73.4M   16n     0     0    0n /
246 72.8K  166n    26  102M    3n     0     0    0n /
320 88.7K  318n    38 51.7M   25n     2   768 1.41u /
283 89.1K  124n    30  118M    3n     0     0    0n /
1.04K  760K   80n   156 45.4M   25n    21 4.02K 3.01u /
2.76K 1.88M  117n   390   89M    2n    43 16.5K  915n /
1.04K  558K  159n   147 33.1M    2n    20 3.02K 2.21u /
3.03K 2.85M   73n   412 36.4M   25n    43 16.7K  1.1u /
I don’t use fsstat as frequently as iostat; nevertheless, this is a really useful addition.